Trends
The Trends view zooms out from a single call to your usage over time.
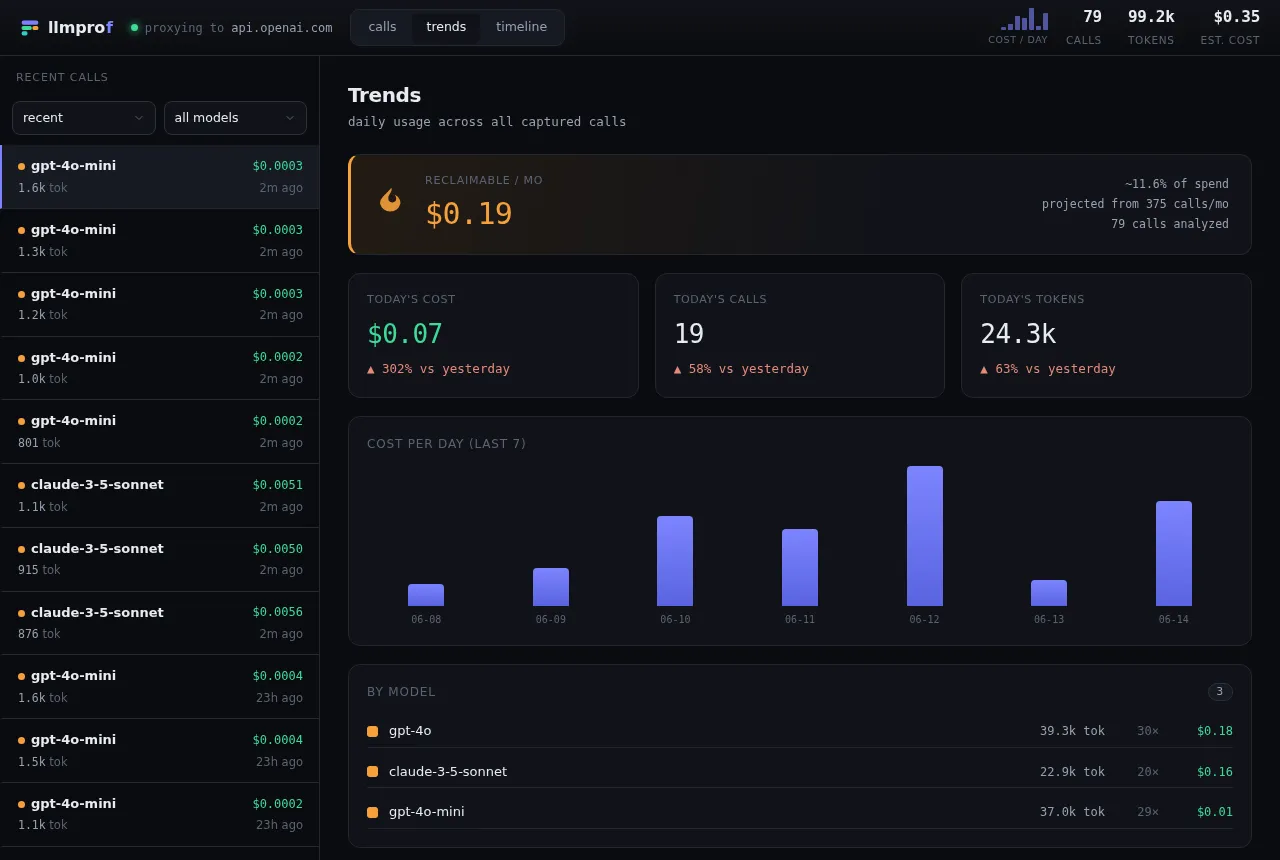
Reclaimable per month
Section titled “Reclaimable per month”The banner up top is the headline number: total reclaimable spend, projected to a month from your observed call rate, with the percent of spend it represents and how many calls it was computed from. See The waste detector for how it is calculated.
Today vs yesterday
Section titled “Today vs yesterday”Three cards show today’s cost, calls, and tokens, each with a delta against yesterday so you can spot a sudden jump.
Cost per day
Section titled “Cost per day”A bar chart of cost for the last 14 days (the screenshot shows a 7-day window of seeded data), so spend spikes are easy to see.
By model
Section titled “By model”A breakdown of tokens, call count, and cost per model, most expensive first - a quick answer to “which model is costing me the most?”
The cost leaderboard lives just below this, grouping by prompt template rather than by model.