Context flame graph
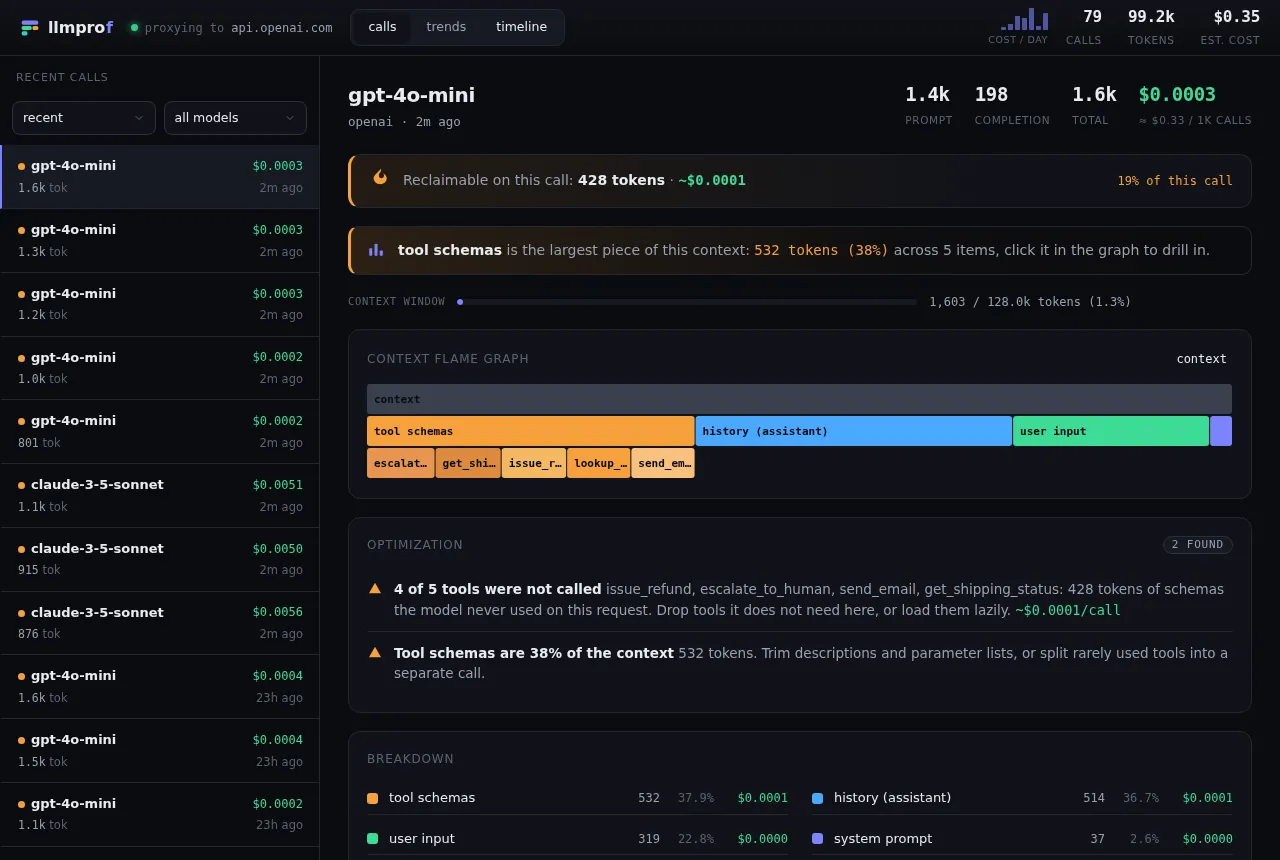
The flame graph is the core view: it shows what a single request’s context window is actually made of, so the waste is obvious at a glance.
Reading it
Section titled “Reading it”- The top row is the whole
context. Each row below splits it into components (system prompt,tool schemas,history (assistant),user input, …), sized by token count, heaviest first. tool schemasexpands into one child per tool, so you can see which specific tool definitions are eating tokens.- Hover any frame for its exact tokens, share of context, and input cost. Click a frame to zoom in; use the breadcrumb to zoom back out.
The header
Section titled “The header”Right under the model name, a strip calls out reclaimable on this call - tokens and dollars - and what percent of the call’s cost that is. Below it, the key stats (prompt / completion / total / cost) and a context-window gauge.
Optimization findings
Section titled “Optimization findings”The optimization panel lists concrete waste for this call (unused tools, duplicated content, oversized schemas, uncached prefix), each with a per-call saving where it can be quantified. The full logic is in The waste detector.
Tip: find the worst offenders fast
Section titled “Tip: find the worst offenders fast”In the calls list, sort by needs attention to push the calls with the most findings to the top, or by most $ to start with the priciest.