Context timeline
Single calls tell you about one request. The timeline shows what happens across a multi-turn run - the “context creep” that quietly inflates every later call.
How runs are detected
Section titled “How runs are detected”llmprof groups consecutive calls into a run automatically: when a call’s messages
start with a previous call’s full message list, it is treated as the next turn.
No code change required. To group calls explicitly instead, send an
x-llmprof-session header. (Details in Architecture.)
Reading the chart
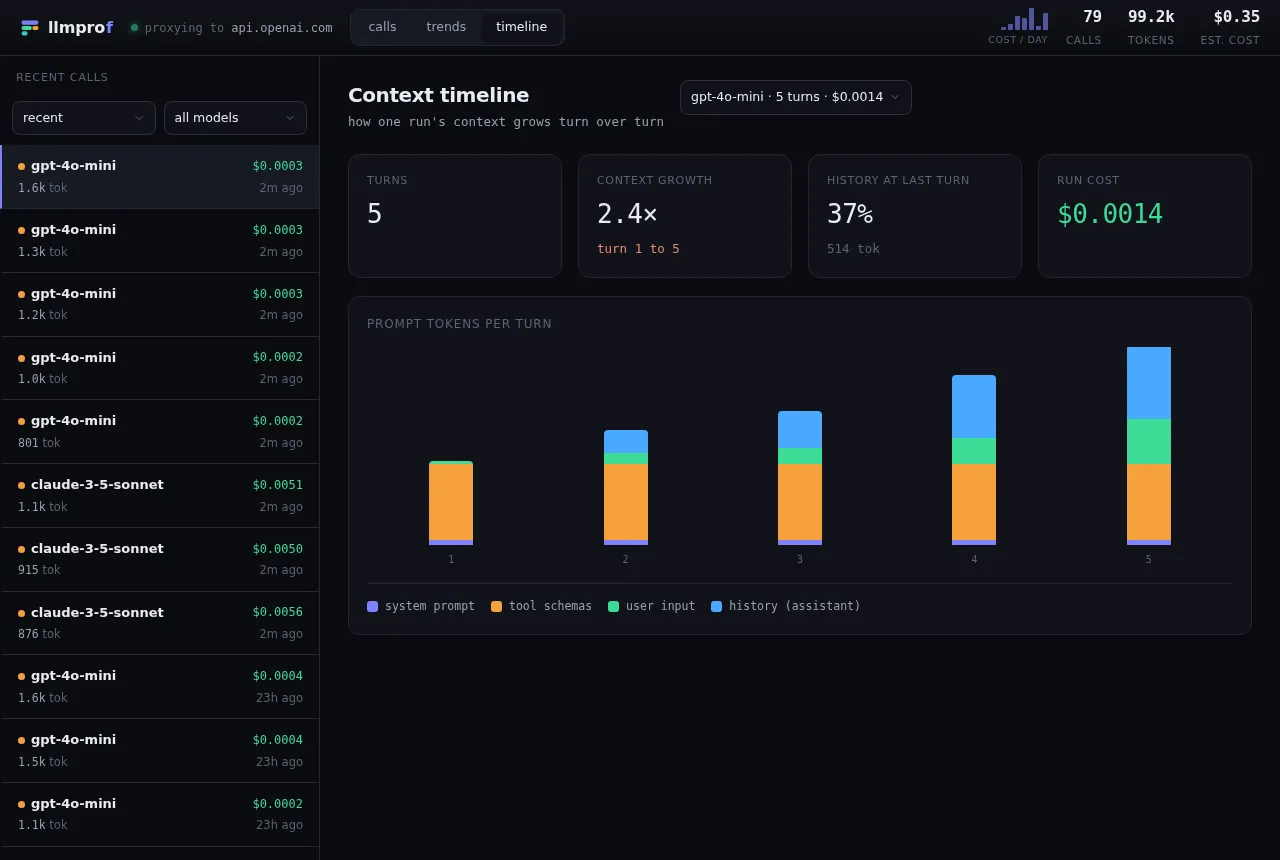
Section titled “Reading the chart”Each bar is one turn, stacked by component. The story to look for: the
history (assistant) band grows turn over turn while system prompt and
tool schemas stay flat - that is context creep, and it is what makes turn 10
cost several times more than turn 1.
The cards
Section titled “The cards”- Turns - how many calls in this run.
- Context growth - last turn’s prompt tokens vs the first turn’s (e.g. 2.4x).
- History at last turn - what share of the final call is history + tool results, the usual culprit.
- Run cost - total spend across the run.
Pick a different run from the dropdown at the top right.