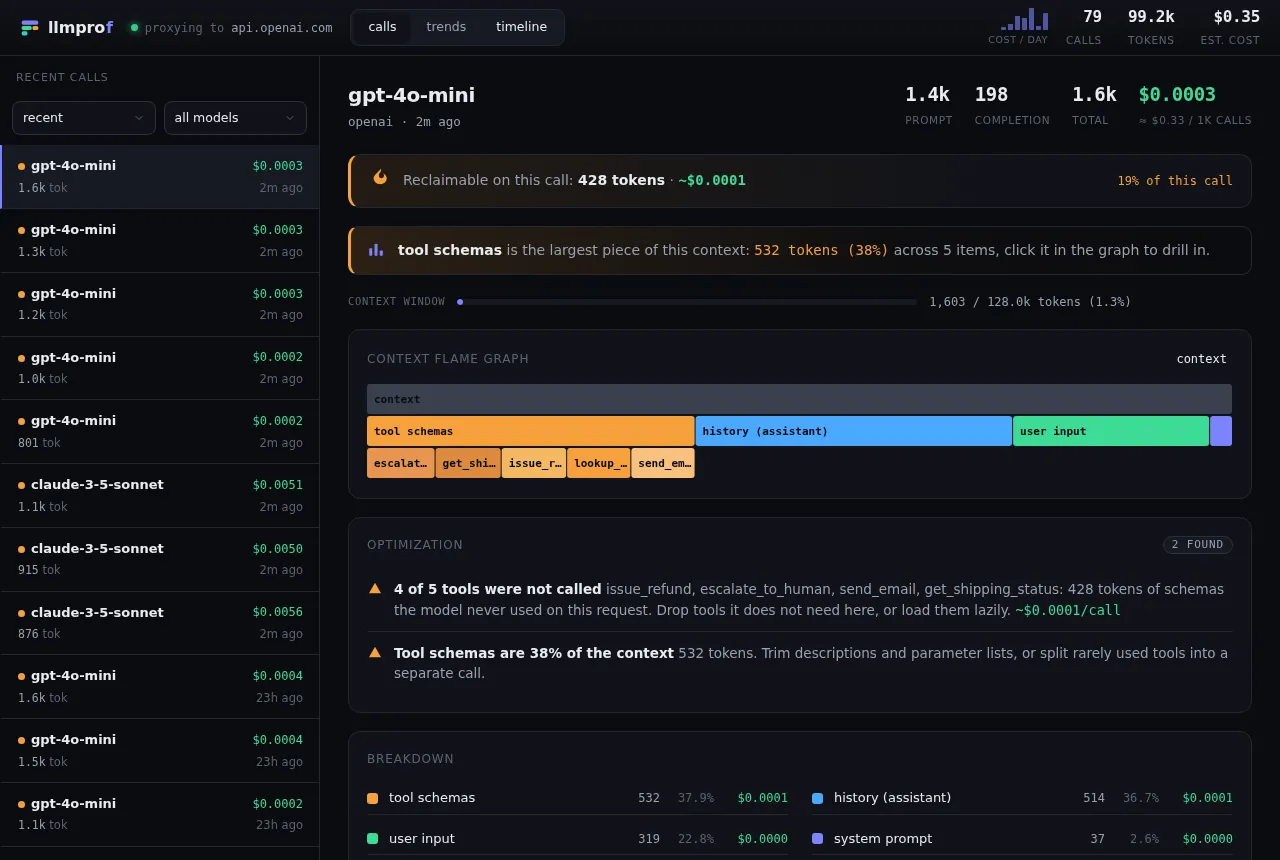
Context flame graph
One request’s tokens broken down by component, with per-tool drill-down. The fat bar is usually the waste.
You profile CPU and memory. Why are you flying blind on the most expensive resource in your AI app - the context window?
llmprof is a local, zero-config profiler for LLM calls. Point your client’s
base_url at it; it forwards requests to the real provider (your API key passes
straight through), and on the way it breaks each request’s prompt tokens into the
components that make it up, prices the call, and flags what is wasteful.
Open the interactive demo → - the real dashboard on a recorded session, no install.
Context flame graph
One request’s tokens broken down by component, with per-tool drill-down. The fat bar is usually the waste.
Reclaimable dollars
A waste detector that flags duplicated content, unused tool schemas, and uncached prefixes - with a “$X/mo reclaimable” headline.
Context timeline
Watch context creep across an agent’s turns: history balloons while the system prompt and tools stay flat.
Cost leaderboard
Which prompt template actually drives your bill - grouped by system prompt and tool set, ranked by total cost.
pipx install llmprofllmprof up# then point your client at http://localhost:4000/v1 and open http://localhost:4000No Python? npx llmprof up runs it with no Python install - see
Installation.
Runs fully local. Your prompts never leave the machine. Works with any OpenAI- or Anthropic-compatible client, including Claude Code and the Codex CLI.